
Hacking my office Indy 500 pool: exploiting arbitrage in an inefficient market
Series: tangential, data sci May 31, 2016
We run an Indy 500 pool at my office every year. Because I am both a fantasy sports degenerate and a software engineer, it was inevitable that I would try way too hard to win. The result was a arbitrage prediction model that I built to help me crush the competition.
The rules of the pool:
- Select 3 drivers, one from each qualifying tier (tier 1: 1-11, tier 2: 12-22, tier 3: 23-33)
- Your score is the combined finish of your drivers
- Lowest score wins $100, one entry per person
Why an arbitrage model made sense
Unlike some fantasy sports tournaments, all entries were public knowledge before the contest started – in our case, you posted your driver picks on the wall in the breakroom.
Arbitrage, in the traditional sense, involves finding a pricing difference in two markets and capitalizing on this mismatch.
An arbitrage model for my Indy 500 pool leverages the difference in the chance that a driver has to win the race (the “Vegas odds” market) and the implied chance as represented by the choices made by all the entries (the “company” market, or ownership percentage).
Without public knowledge of the ownership percentage, you are left to predict that yourself and an arbitrage model results can vary wildly if you miss this prediction. But in my office pool, all entries are known so I decided to give it a whirl.
What does the math look like?
Driver: Josef Newgarden
Vegas odds => 8/1 (~11% chance to win)
Number of entries (out of 45) => 1 (~2% ownership)
Arbitrage = 11% - 2% => 9%
Driver: Ryan Hunter-Reay
Vegas odds => 8/1 (~11% chance to win)
Number of entries (out of 45) => 5 (~11% ownership)
Arbitrage = 11% - 11% => 0%
The Vegas odds give both drivers an equal chance at winning the race, but Newgarden’s ownership suggests that he actually has only a 2% chance of winning. In this model, we treat the Vegas odds as “correct” so there is an inefficiency in the entries.
In a winner-takes-all game, we should pick Newgarden over Hunter-Reay. They have the same chance to win, but less people are picking Newgarden so if he finishes near the top, we will jump ahead of more people in the standings.
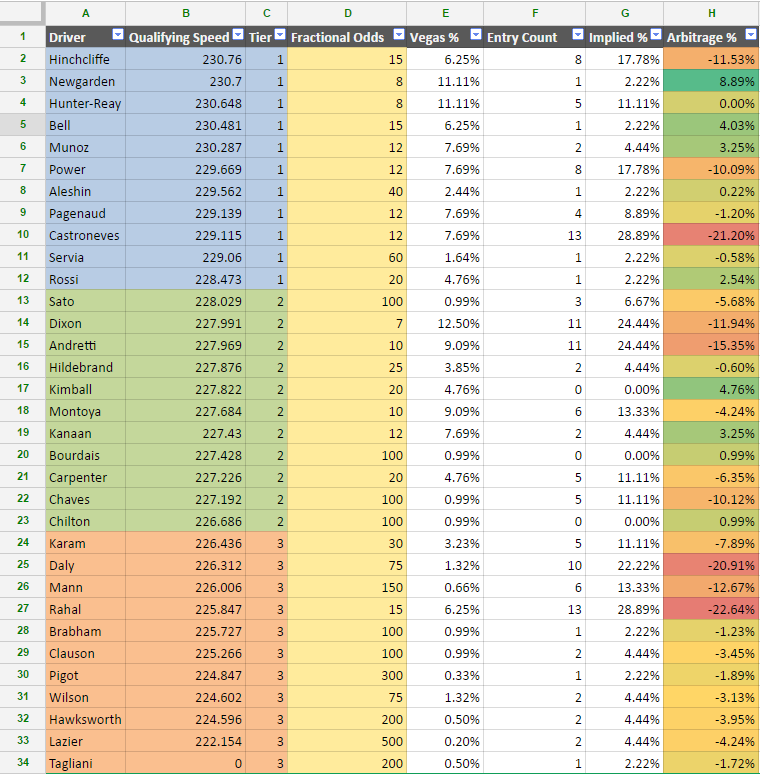
Repeat the same calculations for each driver and you can build a nice little spreadsheet. Sorting by the “Arbitrage Percentage” shows the top picks.
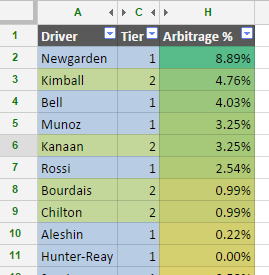
In this case, Newgarden, Bell, Munoz, and Rossi are the top picks among tier 1 drivers. Kimball and Kanaan are the top picks among tier 2 drivers. None of the tier 3 drivers present an opportunity for arbitrage (all negative percentages).
The goal is to maximize the arbitrage percentage with your picks. So in this case – if we follow the model exactly – that means picking Newgarden/Kimball/Brabham.
This entry would score: 3+5+22 = 30 – good enough to win this year (actual winner: 32)!
So why didn’t you win?
I made my entry based on incomplete data. I selected my picks with only 35 of the eventual 45 picks submitted. The model with 35 entries had some of the same top options for tier 1 (Newgarden, Rossi) but there was less of a difference among the tier 2 drivers.
Since the arbitrage model says that there is no inefficiency to exploit for tier 3 drivers (all negative), I opted to look at other metrics for my tier 3 pick. Going solely off of Vegas odds, Rahal was the clear best option (his ~6% chance to win was double the next best option). This turned out to be a great pick as Rahal finished 14th (best among tier 3 drivers).
In the end, I used the arbitrage model for my tier 1 pick (Rossi), my adjusted heuristic (Vegas odds) for my tier 3 pick (Rahal), and a gut-feel pick for tier 2 (Montoya). My thinking was that I would make two safer picks for tier 2/3 and go with the arbitrage exploit for my tier 1 pick, but the end result was not successful.
My entry: Rossi/Montoya/Rahal Score: 1 + 33 (no!!) + 14 = 48
When Montoya crashed early in the race, I knew my entry was drawing dead. But it was still encouraging to nail the optimal picks for tier 1 and tier 3 drivers (Rossi won the race, Rahal was the top finisher among tier 3 drivers). My entry finished 22nd overall – though since only the #1 finisher gets a prize, there is no effective difference between 2nd, 22nd, or last.
Had I used my tier 3 heuristic and the full data model, I could have settled on an entry of Newgarden/Kimball/Rahal for a score of 22 – easily crushing the actual winner (32) by a wide margin. I shed a single tear for what could have been :(
As with any kind of predictive modeling, we can only play the percentages. In reality, a discrete event happens and we get a result – a result that might not be what we hoped for. In this case, the model predictions were very strong, but the race results could easily have been different and this whole effort look foolish.
All we can do is increase the chances of success and, in the immortal words of Antifragile Sports Analytics Based God Sam Hinkie, trust the process. #TrustTheProcess
Prior Art/Inspiration:
Getting Something for Nothing - A Theory of Drafting/Signing Undervalued Wide Receivers